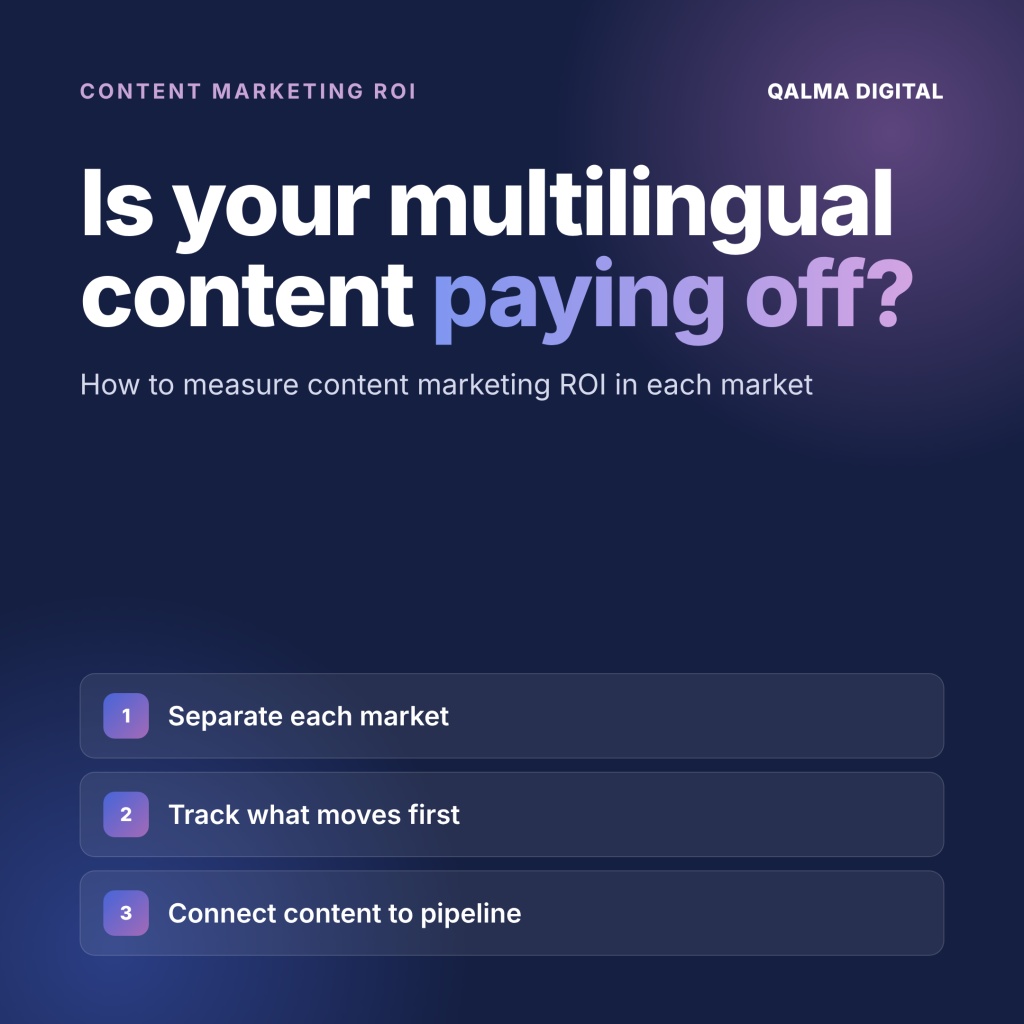
Short answer: Measure multilingual content one market at a time. Separate the market’s data by country and language folder, remove branded searches, and track leading indicators (impressions, rankings, AI visibility) before lagging ones (non-branded traffic, leads, pipeline). Then calculate return from leads and revenue, using your own conversion rates, and compare the cost per lead with your paid channels in the same market.
Multilingual content ROI is the revenue that content in a market’s own language generates, compared with what it costs to produce. Measuring it means separating each market’s data, tracking the numbers that move first, and connecting content to leads and pipeline.
Three months after launching content in a new market, someone in a leadership meeting asks whether it’s working. The organic traffic chart for the whole site barely moved, the new market’s numbers are mixed in with brand searches from a paid campaign, and the first demo request from that country came in through a sales rep’s email. The content might be working. There’s just no clean way to show it.
Most of the difficulty in measuring content marketing ROI across languages comes from the data setup, not the content. This guide covers how to separate a market’s data, which numbers move first, how to connect native-language content to pipeline when sales cycles are long, and how to calculate the return in a way that holds up in front of a CFO.
Why multilingual content ROI is hard to read
Branded traffic is the first problem. When a company enters a new market, it usually runs paid campaigns, partnerships and sales outreach at the same time as content. All of them increase searches for the brand name, and those searches land in the same organic traffic report. Without filtering them out, content gets credit for growth it didn’t create, or the brand’s growth hides what content did.
Volume is the second. Smaller markets have smaller search volumes, so a few hundred visits a month can be a strong result, and SEO tools estimate traffic less reliably where there’s less data behind the estimate.
The third is how B2B buyers buy. According to Gartner, buyers spend only 17% of their time meeting potential suppliers when they’re considering a purchase. Most of the research happens on their own, often weeks before they fill in a form. A buyer who read three of your German articles and then booked a demo after a LinkedIn ad shows up in last-click reports as a paid conversion.
Step 1: Separate each market’s data
In Google Search Console, filter the Performance report by page, using the language folder of the market (for example /de/ or /es/), and add a country filter when you want to see one country. The two filters answer different questions. A German folder is read in Germany, Austria and Switzerland, and Spanish content can rank in Spain and across Latin America. The page filter shows how the localized content performs, and the country filter shows how a market performs.
Then remove branded searches. Search Console’s query filter accepts regular expressions, including a “doesn’t match regex” option, so one pattern can exclude every variant of the brand: the name, common misspellings, versions without accent marks, the product name in the local language and searches like “login” or “pricing” combined with the brand. What remains is non-branded search, the traffic that comes from people who didn’t know the brand yet.
Two caveats are worth knowing before you report these numbers. Search Console hides some rare queries for privacy reasons, so totals filtered by query are lower than totals filtered by page. Comparing trends over time is more reliable than reading the absolute numbers. And if the language versions aren’t connected correctly with hreflang, the wrong version can rank in a market, which makes one market look weaker and another stronger than they are.
In Google Analytics 4, build the same split: sessions from organic search, landing pages in the market’s language folder, and the key events that matter for the business, such as trial sign-ups and demo requests.
Step 2: Track leading indicators first
Content in a new market produces results in a predictable order, and reporting in that order keeps the conversation with leadership grounded.
The first signals are impressions and rankings: new articles get indexed, start appearing for the non-branded queries chosen in local keyword research, and move toward the first page. Next come non-branded clicks to the localized articles. Leads and pipeline follow later, because they need both traffic and time for buyers to move through the cycle. How long each stage takes depends on the competition in the market, the domain’s existing authority and how much content is published, so the useful question at the three-month mark is whether the leading indicators are moving in the right direction.
AI visibility now belongs among the leading indicators too, and it’s where most AEO metrics come from. Since June 2026, Search Console has a generative AI performance report that shows how often a site’s pages appeared in AI Overviews, AI Mode and Discover’s generative AI features, broken down by page, country, device and date. It was rolled out to all websites by the end of August 2026. It reports impressions only and doesn’t show which queries triggered them, but filtered by country and by the language folder, it shows whether the localized content is being picked up in AI answers in that market.
For ChatGPT, Perplexity and other assistants, AI visibility tools such as Peec AI track how often a brand is mentioned or cited for a fixed set of prompts over time. Set the prompts up in the local language for each market. Results for English prompts say little about how the brand shows up when a buyer asks the same question in German or Spanish.
Step 3: Connect content to pipeline
Three methods together give a reasonable picture of how content contributes to organic lead generation in each market, even when buyers don’t convert on the first visit.
The first is self-reported attribution. Add an optional “How did you hear about us?” field to the demo and trial forms, in the local language, with a free-text answer. Buyers often mention an article, a search or a specific question they looked up, which no analytics tool would have recorded.
The second is the CRM. Store the first landing page and its language for every new lead, so leads whose first visit was a localized article can be reported as their own segment. Over a few months, that segment shows how many leads, opportunities and deals started with content in each market.
The third is the conversion path. GA4’s attribution reports show conversions where organic search or a specific landing page appeared earlier in the path, which catches the buyer who read the articles first and converted later through another channel. Teams with long sales cycles and several channels often add a B2B attribution tool such as Dreamdata or HockeyStack, which connects website visits to opportunities in the CRM across the whole buying group.
Step 4: Calculate content marketing ROI per market
With non-branded traffic and conversion data separated, the calculation itself is simple:
- Monthly new revenue from content = non-branded sessions to localized content × visit-to-lead rate × lead-to-customer rate × average first-year contract value
- ROI = (revenue from content − content cost) ÷ content cost
- Content cost per lead = monthly content cost ÷ leads from localized content
Here’s how it works with illustrative numbers. A localized blog brings 1,500 non-branded sessions a month in one market. If 1% of those visits become a trial or demo request, that’s 15 leads. If 10% of leads become customers with a first-year contract value of $6,000, the month’s content-sourced leads are worth $9,000 in first-year revenue. With content costing $3,000 a month, the content cost per lead is $200, which can be compared directly with the cost per lead from paid search in the same market.
The conversion rates in the example are placeholders. Your own rates from the English market are a better starting point than any industry benchmark, and after three to six months, the market’s own data should replace them. Two things make the real picture better than a single month suggests: articles keep bringing traffic after they’re published, so each month’s content adds to the traffic of the months before, and the first-year contract value understates customers who stay longer.
SEO tools also show a “traffic value”: the estimated cost of buying the same clicks through Google Ads. It’s useful as a quick comparison, but it values clicks at the market’s cost per click and ignores what the visitors do next. Click prices differ a lot between markets, so the same traffic can look cheap in one market and expensive in another. For a budget decision, leads and revenue are the numbers that matter.
What a monthly market report should include
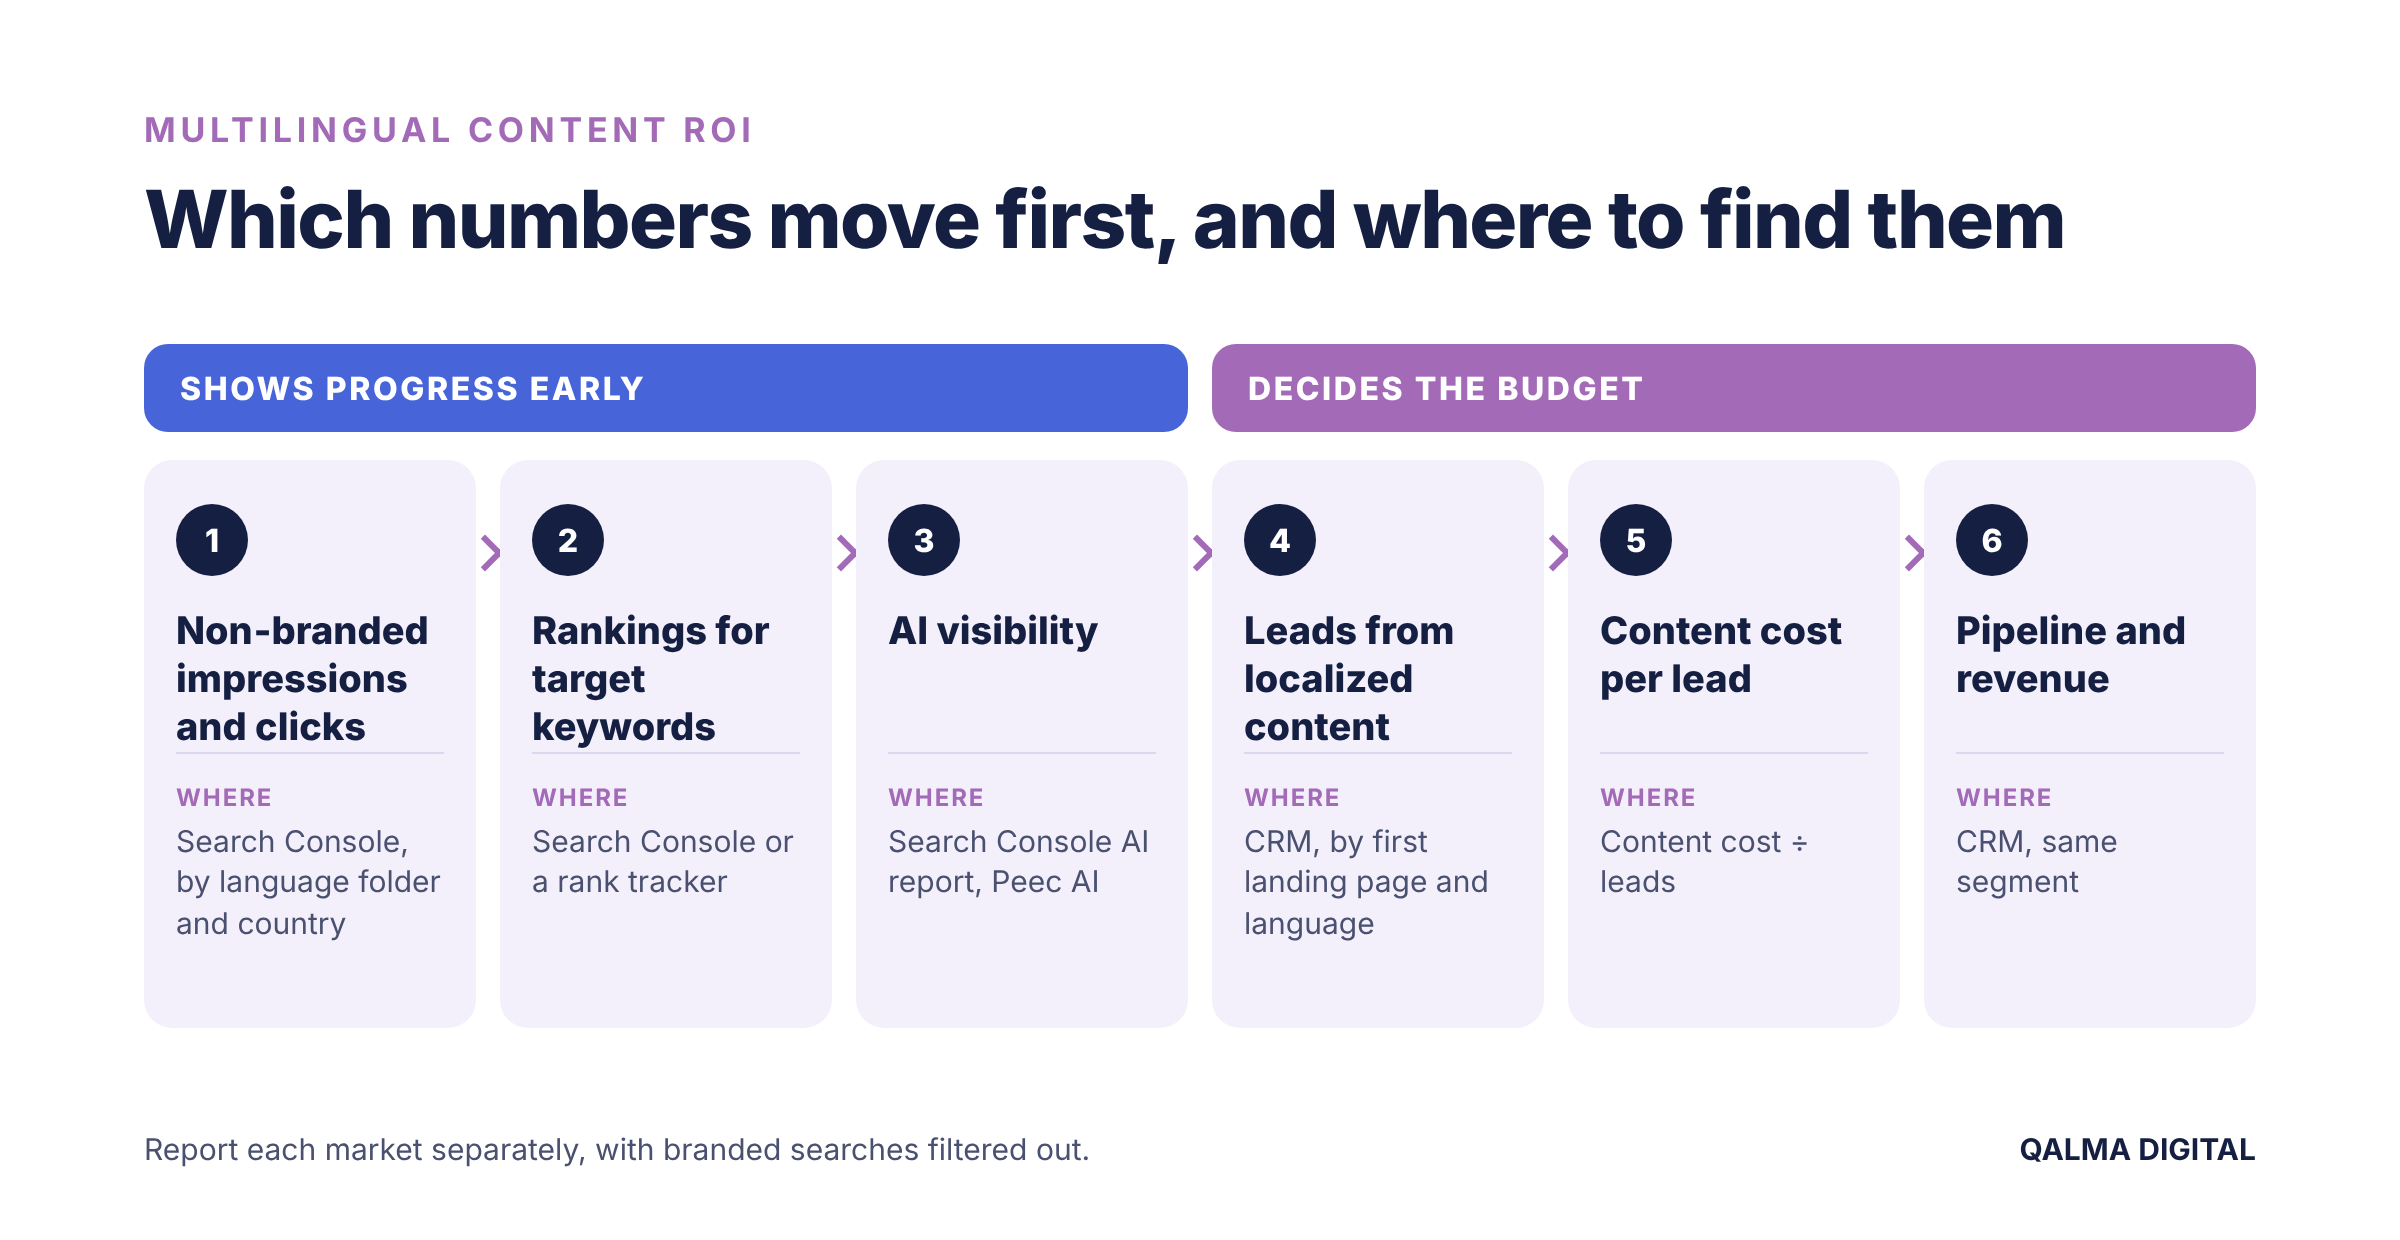
Metric | Where to find it | What it tells you |
Non-branded impressions and clicks | Search Console, filtered by language folder, country and a regex excluding brand terms | Whether the content reaches people who didn’t know the brand |
Rankings for target keywords | Search Console or a rank tracker, set to the market’s country and language | Whether the content competes with local pages |
AI visibility | Search Console generative AI report, filtered by country and page; monthly prompt checks in the local language | Whether the content appears in AI answers in that market |
Leads from localized content | CRM segment by first landing page and language; self-reported attribution | How many leads content started or influenced |
Content cost per lead | Content cost ÷ leads from localized content | How content compares with paid channels in the market |
Pipeline and revenue | CRM, same segment | Whether the leads turn into business |
The first two rows show multilingual SEO progress early. The last three decide the budget.
How Qalma Digital reports on multilingual content
Qalma Digital works toward revenue-focused organic growth, so reporting is set up per market from the start of a project. The monthly report for each market covers non-branded organic traffic, rankings for target keywords and AI citations, and, where the client shares CRM data, the leads that came from localized content.
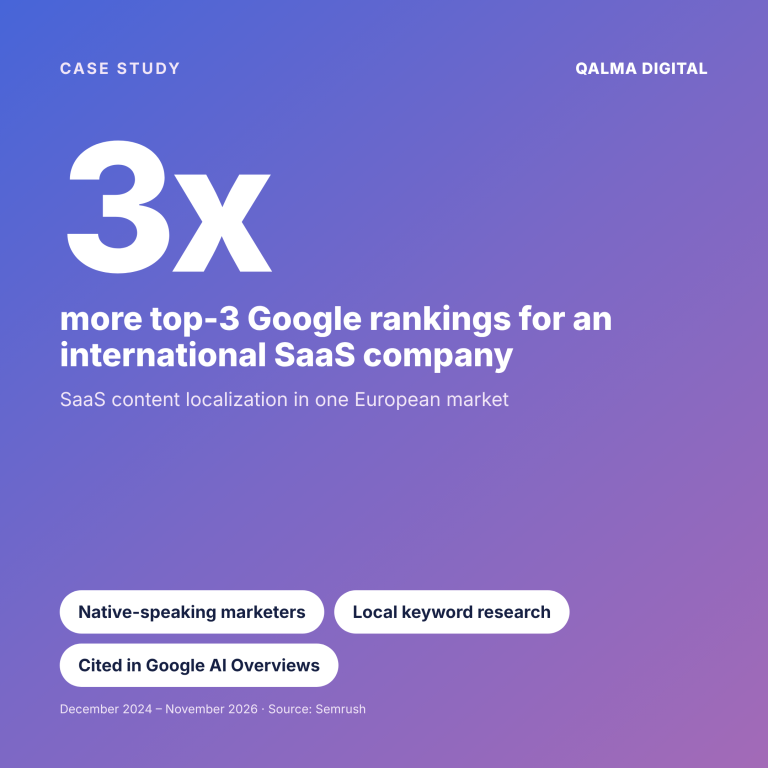
The branded and non-branded split changes the picture more than most teams expect. In the market analyzed in the SaaS content localization case study, about two thirds of the client’s organic visits came from people searching for the brand name or the login page. Measured against all organic traffic, the blog’s share looked small. Measured against non-branded traffic, the visitors who didn’t know the brand yet, the blog brought in about a quarter. Reporting is part of every package for multilingual content writing services.
For the cost side of the calculation, see how much content localization costs. If you’re still deciding how much of the work AI can do, AI translation vs. native content localization covers the trade-offs, and if you’re comparing partners, the guide to content localization agencies and how to choose an international SEO agency for SaaS cover what to ask.
FAQ
How do you calculate content marketing ROI for each market?
Subtract the content cost from the revenue that content in the market brought in, then divide by the cost. To estimate the revenue, multiply non-branded sessions to the localized content by the visit-to-lead rate, the lead-to-customer rate and the average first-year contract value, using your own conversion rates. Calculate it per market, with branded searches filtered out, so that brand activity doesn’t inflate the result.
Which metrics show whether multilingual SEO is working?
Non-branded impressions and clicks to the localized pages, rankings for target keywords in the market’s country and language, and impressions in Google’s AI features show progress first. Leads from localized content, content cost per lead and pipeline show whether it pays off. Search Console, GA4 and a CRM segment by first landing page and language cover all of them.
How long does multilingual content take to pay off?
Leading indicators such as impressions and rankings move first, and leads and revenue follow later. How long each stage takes depends on the competition in the market, the domain’s authority and the publishing volume, so there’s no reliable general timeline. Setting checkpoints at three, six and twelve months, with different metrics at each, keeps expectations realistic.
Should I use traffic value to justify the content budget?
Only as a rough comparison. Traffic value estimates what the same clicks would cost in Google Ads, but it ignores conversions and depends on click prices, which differ between markets. Leads, pipeline and content cost per lead are stronger arguments.
What conversion rate should I assume for a new market?
Start with your own rates from the English market and replace them with the new market’s data once there are a few months of it. Generic industry benchmarks mix very different products and buyers, so they’re a weak basis for a budget decision.
Can I measure AI visibility in other languages?
Partly. Search Console’s generative AI report shows impressions in Google’s AI features by country and page, which covers the localized content. For ChatGPT, Perplexity and other assistants, asking the same set of buyer questions in the local language every month and recording which sources they cite gives a consistent, if manual, picture.